College Performance
This page contains information about the historic performance of the College. A copy of the College’s most recent OFSTED report can be found opposite.
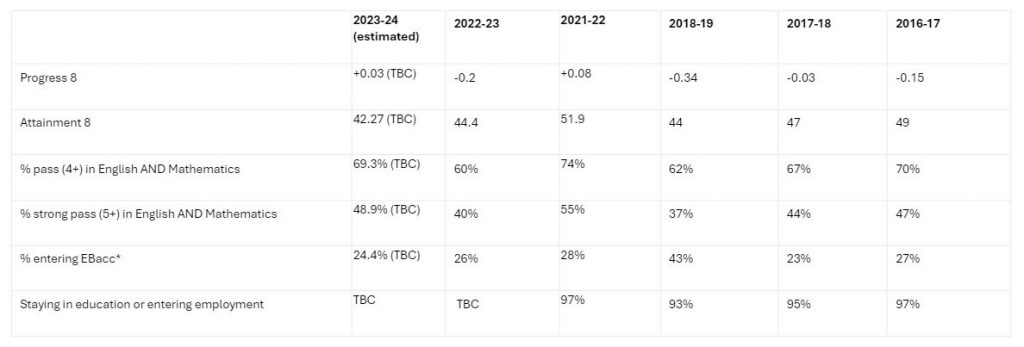
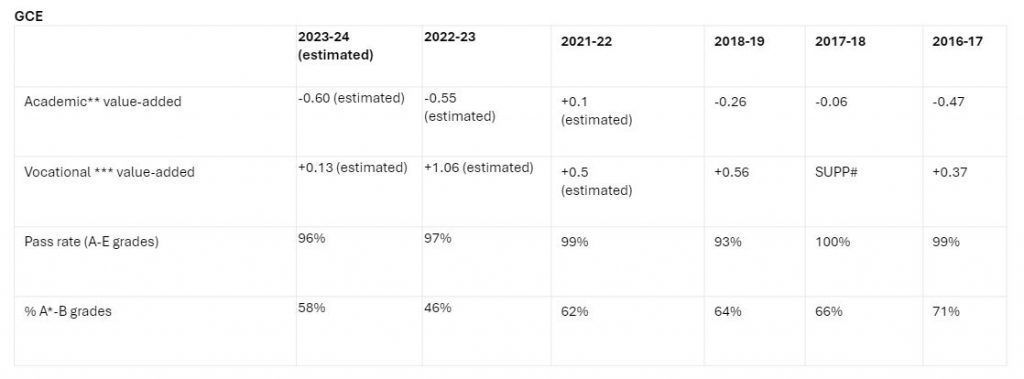
Summary of Recent Exam Results
The tables below present headline performance measures only. Please note that no figures were published for the academic years 2019-20 and 2020-21 due to the cancellation of exams during the pandemic.
For a more detailed analysis of the latest results, please follow this link:
https://www.compare-school-performance.service.gov.uk/school/136638
It is also very important to note that the rapid and significant changes to GCSE gradings, accountability, and changes in performance measures means that it is not possible to compare results year-on-year.
GCSE
2021-22 | 2018-19 | 2017-18 | 2016-17 | |
Progress 8 | +0.09 estimated TBC | -0.34 | -0.03 | -0.15 |
Attainment 8 | 51.91 TBC | 44 | 47 | 49 |
% pass (4+) in English AND Mathematics | 74% TBC | 62% | 67% | 70% |
% strong pass (5+) in English AND Mathematics | 55% TBC | 37% | 44% | 47% |
% entering EBacc* | 28% TBC | 43% | 23% | 27% |
Staying in education or entering employment | 93% | 95% | 97% |
*entering for English, Maths, Sciences, a Language and History or Geography.
GCE
2021-22 | 2018-19 | 2017-18 | 2016-17 | |
Academic** value-added | +0.1 TBC | -0.26 | -0.06 | -0.47 |
Vocational *** value-added | +0.5 TBC | +0.56 | SUPP# | +0.37 |
Pass rate (A-E grades) | 99% TBC | 93% | 100% | 99% |
% A*-B grades | 62% TBC | 64% | 66% | 71% |
# Suppressed due to 5 or fewer students covered by the measure
TBC – this figures are ased on national collaboration data and cannot be finalised untilt he DFE publishes official national performance measures.